Video of the streaming is here:
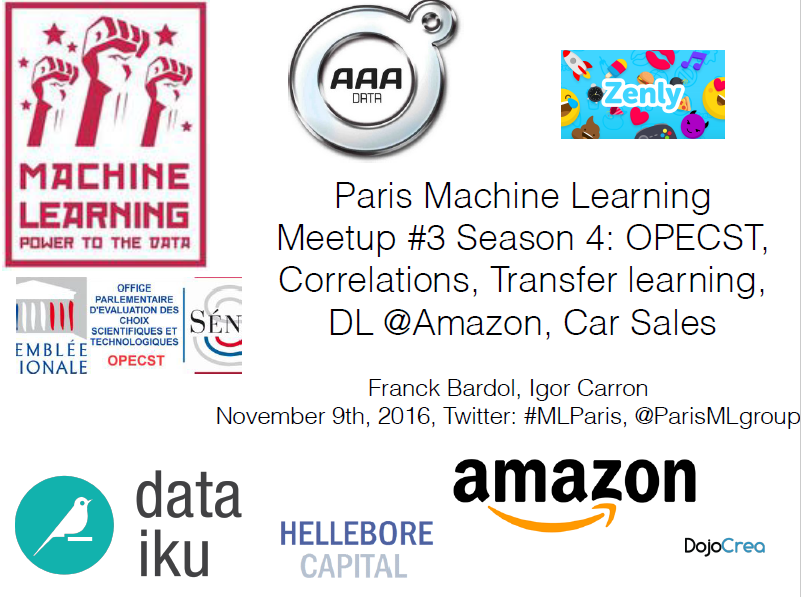
The meetup will be hosted by AAA-data / Comité des Constructeurs Français d'Automobiles and the networking event is sponsored by Zen.ly . A big thank you to them.
The program for this third regular meetup of the season (and the fifth total for season 4) is a little extraordinary this time and will feature the following:
- Dominique Gillot, Sénatrice, ancienne ministre et Rapporteure avec le député Claude de Ganay d'un rapport sur l'Intelligence Artificielle pour le Parlement. Mehdi Benhabri, Administrateur de l'Office parlementaire d'évaluation des choix scientifiques et technologiques (OPECST). Important: Pour celles et ceux qui ne pourraient pas parler à la sénatrice, un questionnaire en ligne est disponible et les réponses seront adressées aux deux rapporteurs et à l'administrateur qui suit le dossier IA. Slide
- Gautier Marti (Hellebore Capital), A closer look at correlations
You may have already read many times that the job of a Data Scientist is to skim through a huge amount of data searching for correlations between some variables of interest. And also, that one of his worst enemies (besides correlation doesn't imply causation) is spurious correlation. But what really is correlation? Are there several types of correlations? Some "good", some "bad"? What about their estimation? This talk will be a very visual presentation around the notion of correlation and dependence. I will first illustrate how the standard linear correlation is estimated (Pearson coefficient), then some more robust alternative: the Spearman coefficient. Building on the geometric understanding of their nature, I will present a generalization that can help Data Scientists to explore, interpret, and measure the dependence (not necessarily linear or comonotonic) between the variables of a given dataset. Financial time series (stocks, credit default swaps, fx rates), and features from the UCI datasets are considered as use cases.
- Yannis Ghazouani (Dataïku), Labelling images using transfer learning. An application to recommender systems
Dataiku recently worked on an e-business vacation retailer recommender system based on users' previously visited products. We created a meta model on top of classical recommender system that generated an increase of 7% in revenue during the A/B test. For this type of business, the content of the product image is paramount. The next step was obviously to add image information in the recommender. The key take away is this: you don’t need a deep learning expert to solve the tagging problem. Because labeled datasets and corresponding pre-trained neural network are available on the Internet, you can use “transfer learning” and map your problem to an existing one. The post processing step consists in grouping labels to get features associated to more global visual themes. For instance, "theme beach" = coast + ocean + sandbar. We use them to recommend customer personalized products or to address marketing issues such as : what kind of image should I propose for this product?
La base de données AAA DATA comptabilise plus de 300 millions d’événements avérés avec un historique unique de plus de 15 ans qui permet de valider la solution prédictive proposée à ses clients. Le challenge a été d’appliquer du machine learning sur ces 300 millions d’événements
 Liked this entry ? subscribe to Nuit Blanche's feed, there's more where that came from. You can also subscribe to Nuit Blanche by Email, explore the Big Picture in Compressive Sensing or the Matrix Factorization Jungle and join the conversations on compressive sensing, advanced matrix factorization and calibration issues on Linkedin.
No comments:
Post a Comment